Are you able to unlock the power of your data?

Too many businesses and departments continue to get held back by sub-standard insight and intelligence covering their operations, performances and environmental factors.

Reports produced by most organisations capture a moment in time and present static data. They invariably arrive too late to react to and can even contain errors causing doubt and unknown risk to the organisation.

The data behind the reports is rarely accessible making it impossible to ask questions or change the way the data is presented.

General “one size fits all”  reports and information delivers limited value or misleading insight.

Modern Business Intelligence and Data analytics can cut through the information noise and empower you with real-time insight to make decisions faster and drive new performances

CEOs that spearhead data-driven decisions are 77% more likely to achieve business goals.

PWC

32%

say Enterprise BI too complex. Complicated, cumbersome to use

45%

Enterprise systems don’t have all the data – 45% is held elsewhere (eg. in Excel spreadsheet)

31%

of employees have to wait days or weeks for an average BI request.

61%

increase in data every year to 2025 (Accenture)

Why do Business Intelligence projects fail?

Slow response to BI requests

BI complexity

Data missing

Over ambitious

Revenue vs other justifications

Components of  Data Analytics / Business Intelligence

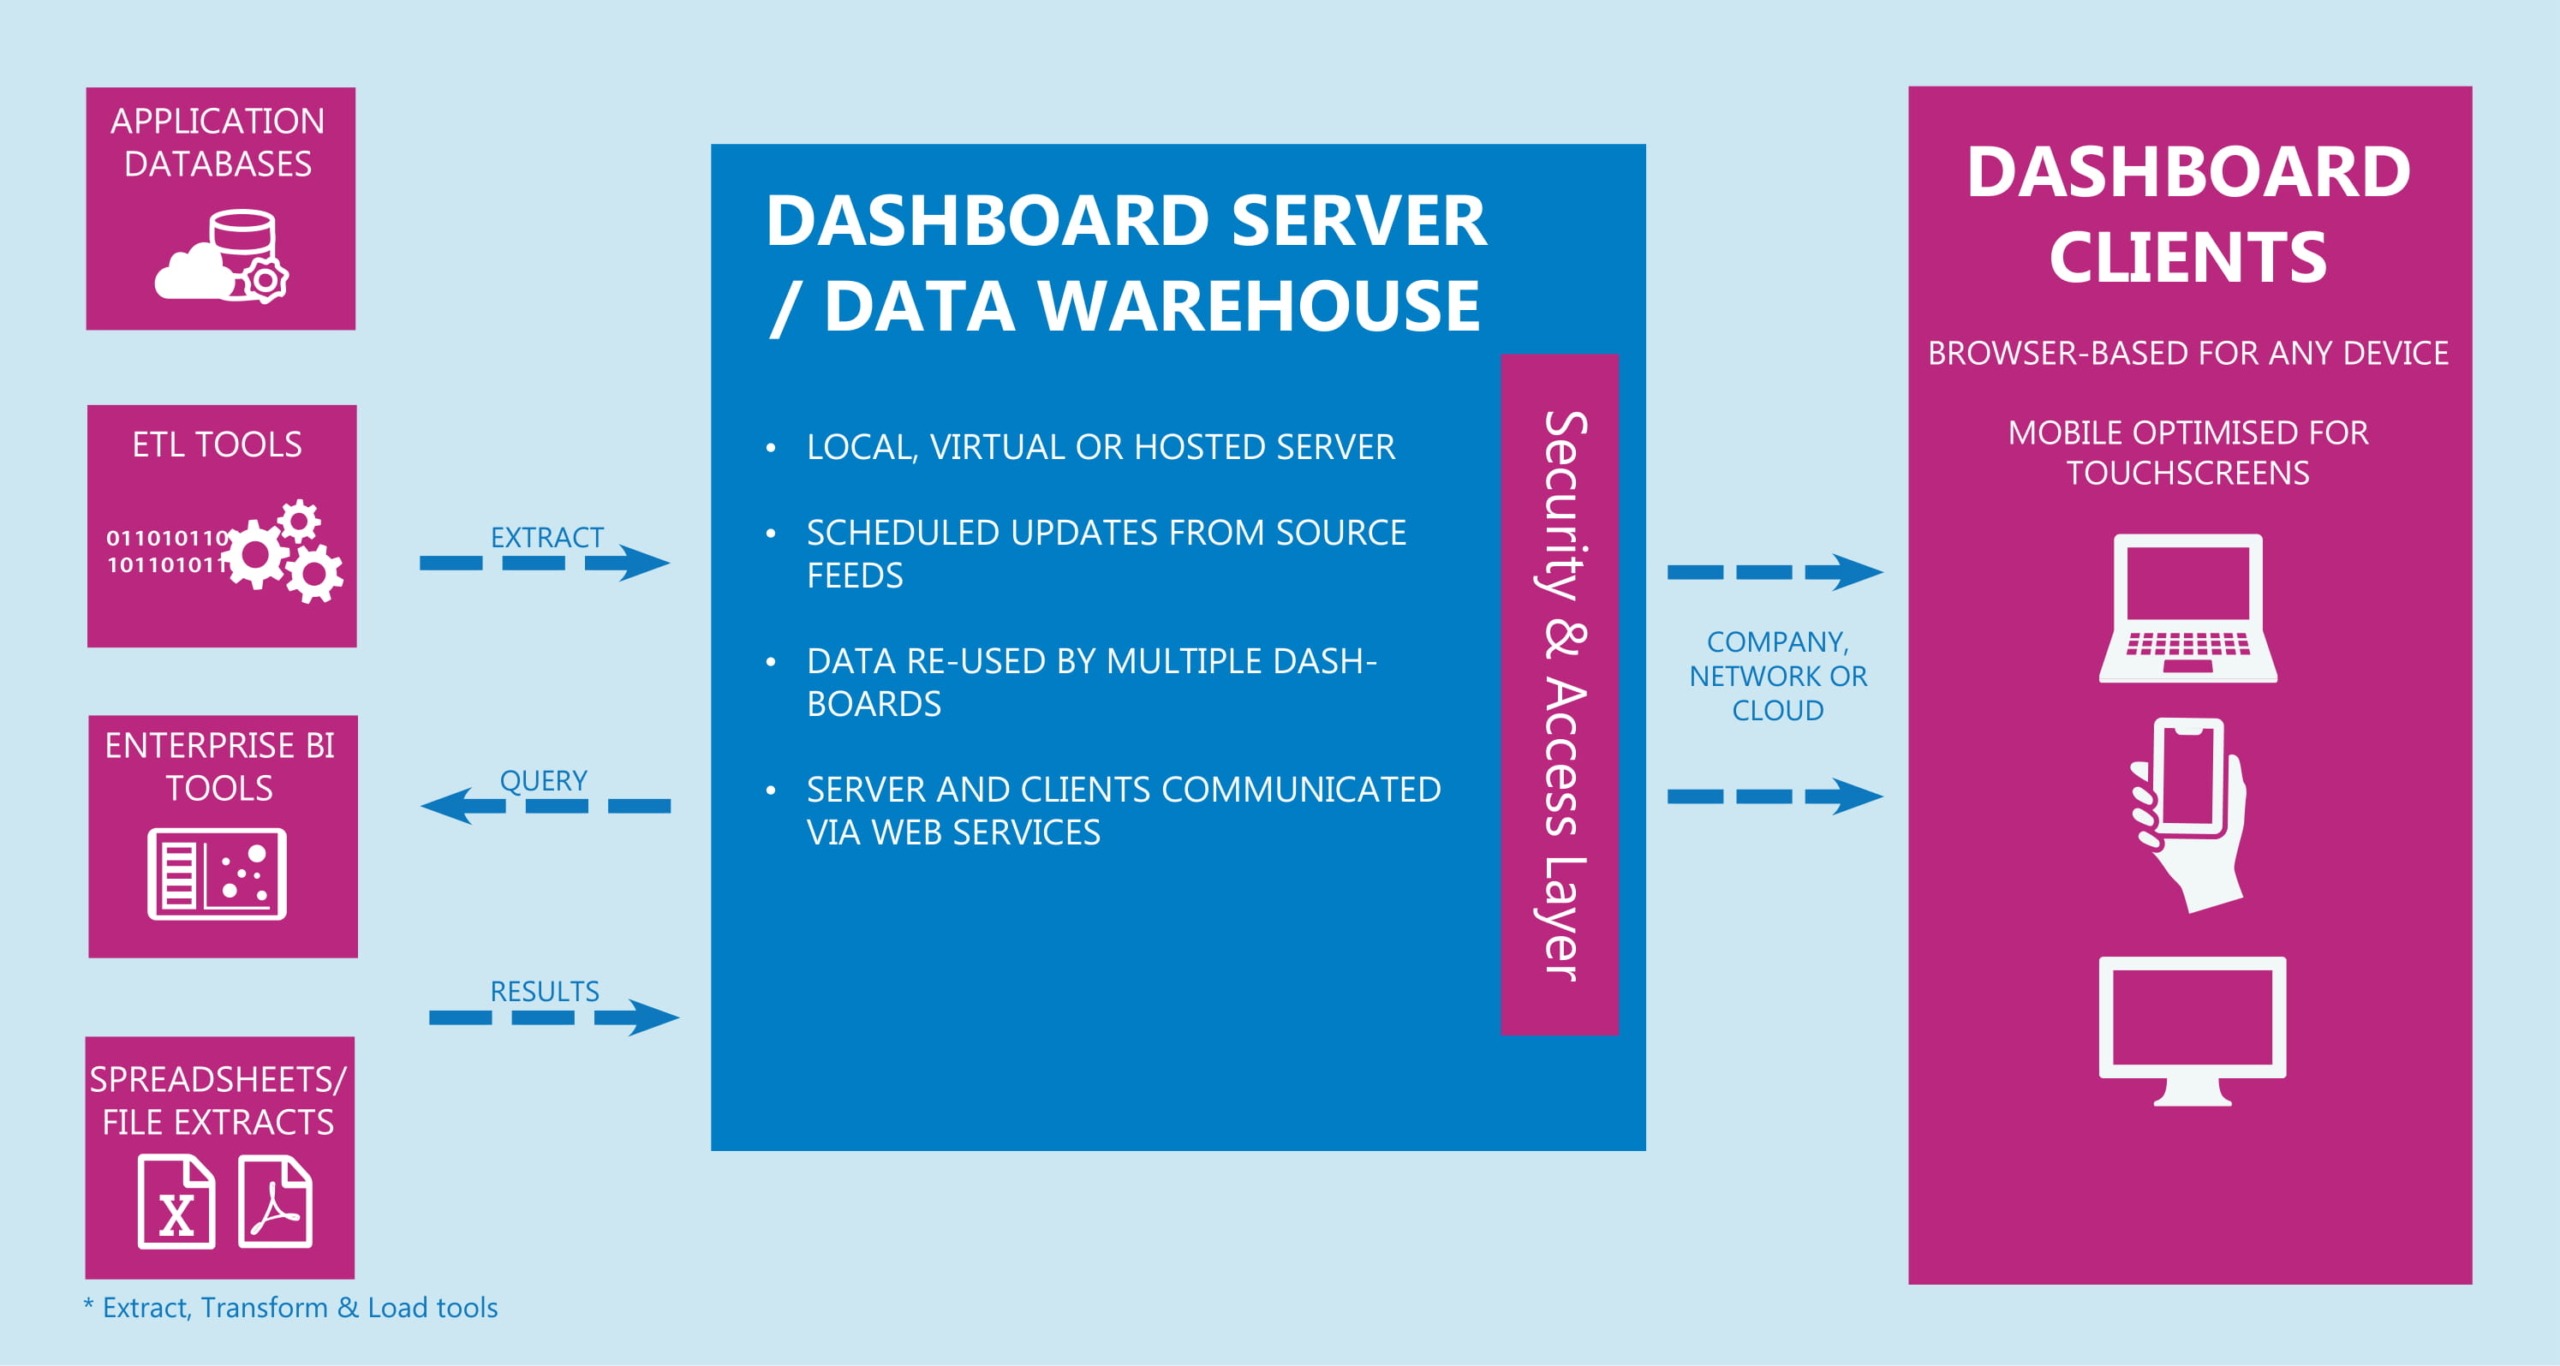
Irrespective of the method of automation or specific technology used, Business Intelligence solutions typically include the following core components and capabilities. These are the core elements of BI and used to retrieve information from core business systems and present the information to end users.

  • Data from source systems such as application databases, CRMs, HR systems, Accounts Payable, Finance.
  • Extract / Transform / Load process
  • Data Presentation / Dashboard

Methods of delivering Business Intelligence / Data Analytics

Methods of delivering business reporting to end users in many organisations is archaic and has not changed greatly, despite advances in technology.

Today, there are essentially 3 separate approaches to Business Analytics:

Hand-built reports using data extracts from individual business systems, merged into Excel and then visualised in static graphs or transposed into Powerpoint slides for senior management report packs.

Off the shelf BI toolsets (such as Microsoft PowerBI, Tableau, IBM Cognos, SAP Business Objects) which require an expert in-house to deliver the completed solution.

Dashboards that are pre-built to integrate to business applications incorporating best practice at lower cost.

Methods for improving Business Intelligence & Reporting

Business Intelligence toolsets can take months or years to deliver. Traditional Business Intelligence implementations are often very lengthy, requiring the specialist skills of BI knowledge workers. Our approach of providing embedded Data Analytics and Dashboards means that organisations can quickly increase the value of the data held in their systems.

Critical success factors are:

Personalisation
Is the data presented relevant to that user and quickly shows them what they need to know, without having to plough through pages of irrelevant content?

Data Enhancement
Is the user provided with more than “raw” data – for example rather than just reporting actual numbers, are these compared against targets, forecasts or historic trends?

Actionable Information
Does the data presented allow the user to take action to correct issues quickly?

Fit for Purpose
Does the data answer the business questions relevant to that user?

Seamless
Is the user able to access the information wherever they are (for example on a tablet or phone in a customer or supplier review meeting?)

Benefits of modern Business Intelligence and Data Analytics

Modern BI and Analytics should deliver the following key benefits:

Simple to use – to encourage user adoption across the organisation

Designed to make data interaction easy for end users without any technical input required

Provide new ways of navigating through the data, simplifying the user journey for more power analytics

Dashboards pre-designed to answer specific business queries

Bring in external data from a range of systems for more powerful analysis eg. achievement against targets, trends over time, what if analysis.

Fast to build and deploy – no endless user waits for new reports to be developed by a stretched in -house IT team.

Complete control over look and feel – colours and formats to match corporate style

Our Customers

From global enterprises and government departments, to local small businesses, here are some of our customers that have partnered with us, using Business Intelligence & Data Analytics to transform their business.

To read all of our success stories, visit our Case Studies page.

Why ProcessFlows for Business Intelligence & Data Analytics?

We have a 35 year track record of success & expertise in BI, Dashboards & Data Analytics for a range of sectors, functions and data types

Flexible models – Delivering BI as a service – no need to buy in expensive contractors to build from a toolset

Low-cost deployment model means you are supported as requirements grow or change

Dashboards are extensively used in-house to support our own business management

For these reasons and more, ProcessFlows should be your trusted partner to support your business transformation.
Find out more by clicking here.

More Information & How Can We Help?

We offer no-obligation consultations to help you identify the right approach to Business Intelligence & Dashboards for your organisation. To find out more or to book a consultation, please call +44 (0)1962 835053, email enquiries@processflows.co.uk, or fill in the form below.

Quick Contact